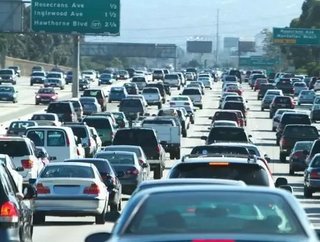
Los Angeles tops INRIX Global Congestion Ranking
INRIX analysed 1,064 cities – 240 in the U.S. – across 38 countries, making it the largest ever study of traffic congestion. Based on the findings, the U.S. ranked as the first most congested developed country in the world, with drivers spending an average of 42 hours a year in traffic during peak hours. For the first time, the INRIX Traffic Scorecard also includes the direct and indirect costs of congestion to all U.S. drivers, which amounted to nearly $300 billion in 2016, an average of $1,400 per driver.
U.S. cities dominated the top 10 most congested cities globally, with Los Angeles (first), New York (third), San Francisco (fourth), Atlanta (eighth) and Miami (10th) each dealing with an economic drain on the city upwards of $2.5 billion caused by traffic congestion. Los Angeles commuters spent an average of 104 hours last year in traffic jams during peak congestion hours – more than any other city in the world. This contributed to congestion costing drivers in Los Angeles $2,408 each and the city as a whole $9.6 billion from direct and indirect costs. Direct costs relate to the value of fuel and time wasted, and indirect costs refer to freight and business fees from company vehicles idling in traffic, which are passed on to households through higher prices.
Interestingly, both New York and San Francisco, the second- and third-ranked cities in North America (89 and 83 peak hours spent in congestion respectively), have a similar average congestion rate (13 percent) as Los Angeles, but show strikingly different traffic patterns during various parts of the day. For example, New York City has the highest daytime congestion on arterials and city streets, while San Francisco holds the top spot at peak times.
Phoenix and Detroit tie for the lowest cost of congestion among the top 25 U.S. cities, at $1,062 per driver, and rank among the bottom in all three categories of costs: commuting, business and leisure/other. Despite the high costs of congestion in New York and other cities, American drivers, in general, have it easier than their German counterparts. At $1,938, congestion costs the average German driver 38 percent more than an American, after adjusting for exchange rates and the cost of living.
“A stable U.S. economy, continued urbanization of major cities, and factors such as employment growth and low gas prices have all contributed to increased traffic in 2016. Congestion also costs our country hundreds of billions of dollars, threatens future economic growth and lowers our quality of life. Traffic truly is a double-edged sword,” said Bob Pishue, Senior Economist at INRIX. “The demand for driving is expected to continue to rise, while the supply of roadway will remain flat. Using big data and technology to improve operations of existing roadways offers a more immediate impact on traffic flows and mobility while transportation officials explore strategic capital investments.”
Table 1: 10 Most Congested Urban Areas in the U.S.

INRIX 2016 Traffic Scorecard Provides In-Depth City Congestion Analysis
New to the 2016 Traffic Scorecard is the ability to study congestion at different times of the day and across different parts of the road network, such as analysing traffic in downtown areas compared to vehicles coming in and out of a city, inside and outside of peak hours, and at weekends. U.S. insights include:
Overall (Peak & Non-Peak) Congestion Insights
- While drivers in Los Angeles spent the most peak hours in traffic, Boston drivers spent the highest percentage of their peak travel in congestion – with an average peak congestion rate of 23 percent.
- Stamford, CT has the highest overall congestion rate in the U.S. at 14 percent, but is closely followed by Boston (13 percent), New York City (13 percent), San Francisco (13 percent), Los Angeles (13 percent) and Seattle (13 percent).
Downtown Metro Insights
-
New Yorkers have it tough on arterials and city streets throughout the day, with an average of 16 percent of travel time on weekdays completed.
-
Commuters within San Francisco have the highest U.S. congestion rate on arterial and city streets during the peak commute hours (23 percent).
In and Out of City Insights
- Drivers move more quickly in the South. The top five fastest non-congested speeds during the peak period on highways were all in the South. Greensboro, NC took the top spot at 70 mph.
- Commuters getting into Austin spent more time stuck in traffic than anyone else, with a congestion rate of 28 percent on highways in and out of the city.
Business Impact
- Freight delivery and business-related travel are slowest within Chicago and Boston. Average congested speeds during the daytime within the two cities are just 4.9mph
- Boston, San Francisco, Seattle and Los Angeles round out the top five most congested major cities for businesses, with 13-14 percent of travel congested during the daytime on arterials and city streets.
Weekend Insights
- With 12 percent of the drive time congested, New York City and San Francisco have the highest weekend congestion rates out of the major cities studied.
- Drivers cruise at their slowest in Las Vegas, NV, where weekend congestion speeds are just 5.6 mph.
The Most Congested Corridors in the U.S.
INRIX also identified the most congested corridors in the U.S., as well as the busiest peak periods. New York’s Cross Bronx Expressway tops the INRIX list of worst corridors, with the average driver on the 4.7-mile stretch wasting 86 hours (over 3.5 days) per year in congestion. Three other New York corridors make the top 10. Surprisingly, Los Angeles, with the top spot in peak hours sitting in congestion, only holds one spot on the list of worst corridors – I-10 Eastbound between I-405 and I-110. San Francisco, the third highest ranking city in the U.S. for peak time spent in congestion, doesn’t appear on the U.S. corridors list until the 31st spot.
Table 2: 10 Most Congested U.S. Roads in 2016

How the U.S. Cities Compare to Top Cities Worldwide
At the global city level, Los Angeles tops the list of the world’s most gridlocked cities, with drivers spending 104 peak hours in congestion in 2016, followed by Moscow (91 hours), New York (89 hours), San Francisco (83 hours) and Bogota (80 hours). In addition to Los Angeles, New York and San Francisco, Atlanta and Miami also ranked in the top 10 most congested cities in the world out of 1,064 cities analyzed.
Table 3: 10 Most Congested Cities in the World in 2016

Of the 38 countries covered by the INRIX 2016 Traffic Scorecard, Thailand leads with the highest average hours spent in peak congestion (61 hours), outranking Columbia (47 hours) and Indonesia (47 hours) at second, and Russia (42 hours) and the U.S. (42 hours) at fourth.
Table 4: 15 Most Congested Countries in the World in 2016

Research Methodology
A new methodology was adopted for the 2016 Global Scorecard that calculates the percentage of time that drivers spent in congestion at different periods of the day/week and on different parts of a city’s road network. This provides a more holistic view of a city’s congestion problem. Cities were ranked by the peak hours that the average driver spent in congestion, the busiest part of the day when the most people are affected. Additional metrics are available online and in the full report.
An economic analysis was performed to estimate the total cost to the average driver in a city, and a total cost to the city population. This considered both the direct costs (those borne by the driver directly through wasted time and fuel) and the indirect costs (those borne indirectly through the increased costs to businesses which are passed on to households through higher prices). Worst corridors are limited to those that have the highest traffic volume and are ranked by the average hours of delay per driver in 2016.
Direct & Indirect Costs of Congestion in the U.S.
- Average direct cost per driver $1,210.84
- Average indirect cost Per Driver $188.91
- Average total cost $1,399.75
- Number of cars in the U.S. 210,778,000
- Total cost for the U.S. $295,037,137,168